Usage
To use pitchly in a project:
import pitchly
As of now , pitchly works only with Metrica Sports data format (old and new EPTS FIFA).
So the recommended starting point for now is from pitchly.metrica import ...
Data Loading
kloppy is used to load the tracking and event data from Metrica. Click here for the sample open data
 1import glob
 2import kloppy
 3
 4# match directory
 5match_dir = "/match/folder/with/metrica/data/"
 6
 7# tracking data [METRICA]
 8metadata_file = glob.glob(f"{match_dir}/*metadata*")[0]  # xml file
 9tracking_file = glob.glob(f"{match_dir}/*tracking*")[0]  # txt file
10
11dataset = kloppy.load_epts_tracking_data(raw_data_filename=tracking_file, metadata_filename=metadata_file, options=None)
12
13metadata = dataset.metadata
14tracking_dataset = kloppy.to_pandas(dataset)
15
16# event data [METRICA]
17events_file = glob.glob(f"{match_dir}/*events*")[0]  # txt file
18
19event_dataset = kloppy.load_metrica_json_event_data(
20    raw_data_filename=events_file, metadata_filename=metadata_file, options=None
21)
Basic Football Pitch
pitchly can be used to plot a basic football pitch (currently Metrica data dimensions) and building further on it as needed.
1from pitchly.pitch import Pitch
2
3pitch = Pitch()
4fig = pitch.plot_pitch()

This is however not needed for any further plots as demonstrated below.
Tracking Data
1# import the pitchly wrapper for metrica tracking data
2from pitchly.metrica import TrackingData
3
4# feed the loaded data
5data = TrackingData(tracking_dataset,metadata)
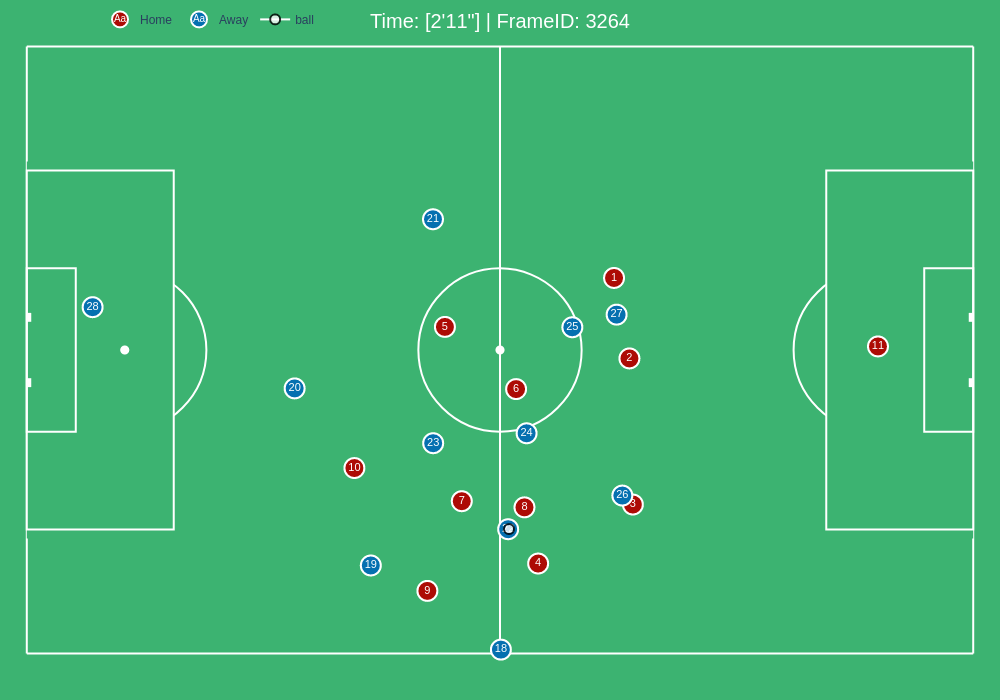
Plot Sequence by FrameIDs
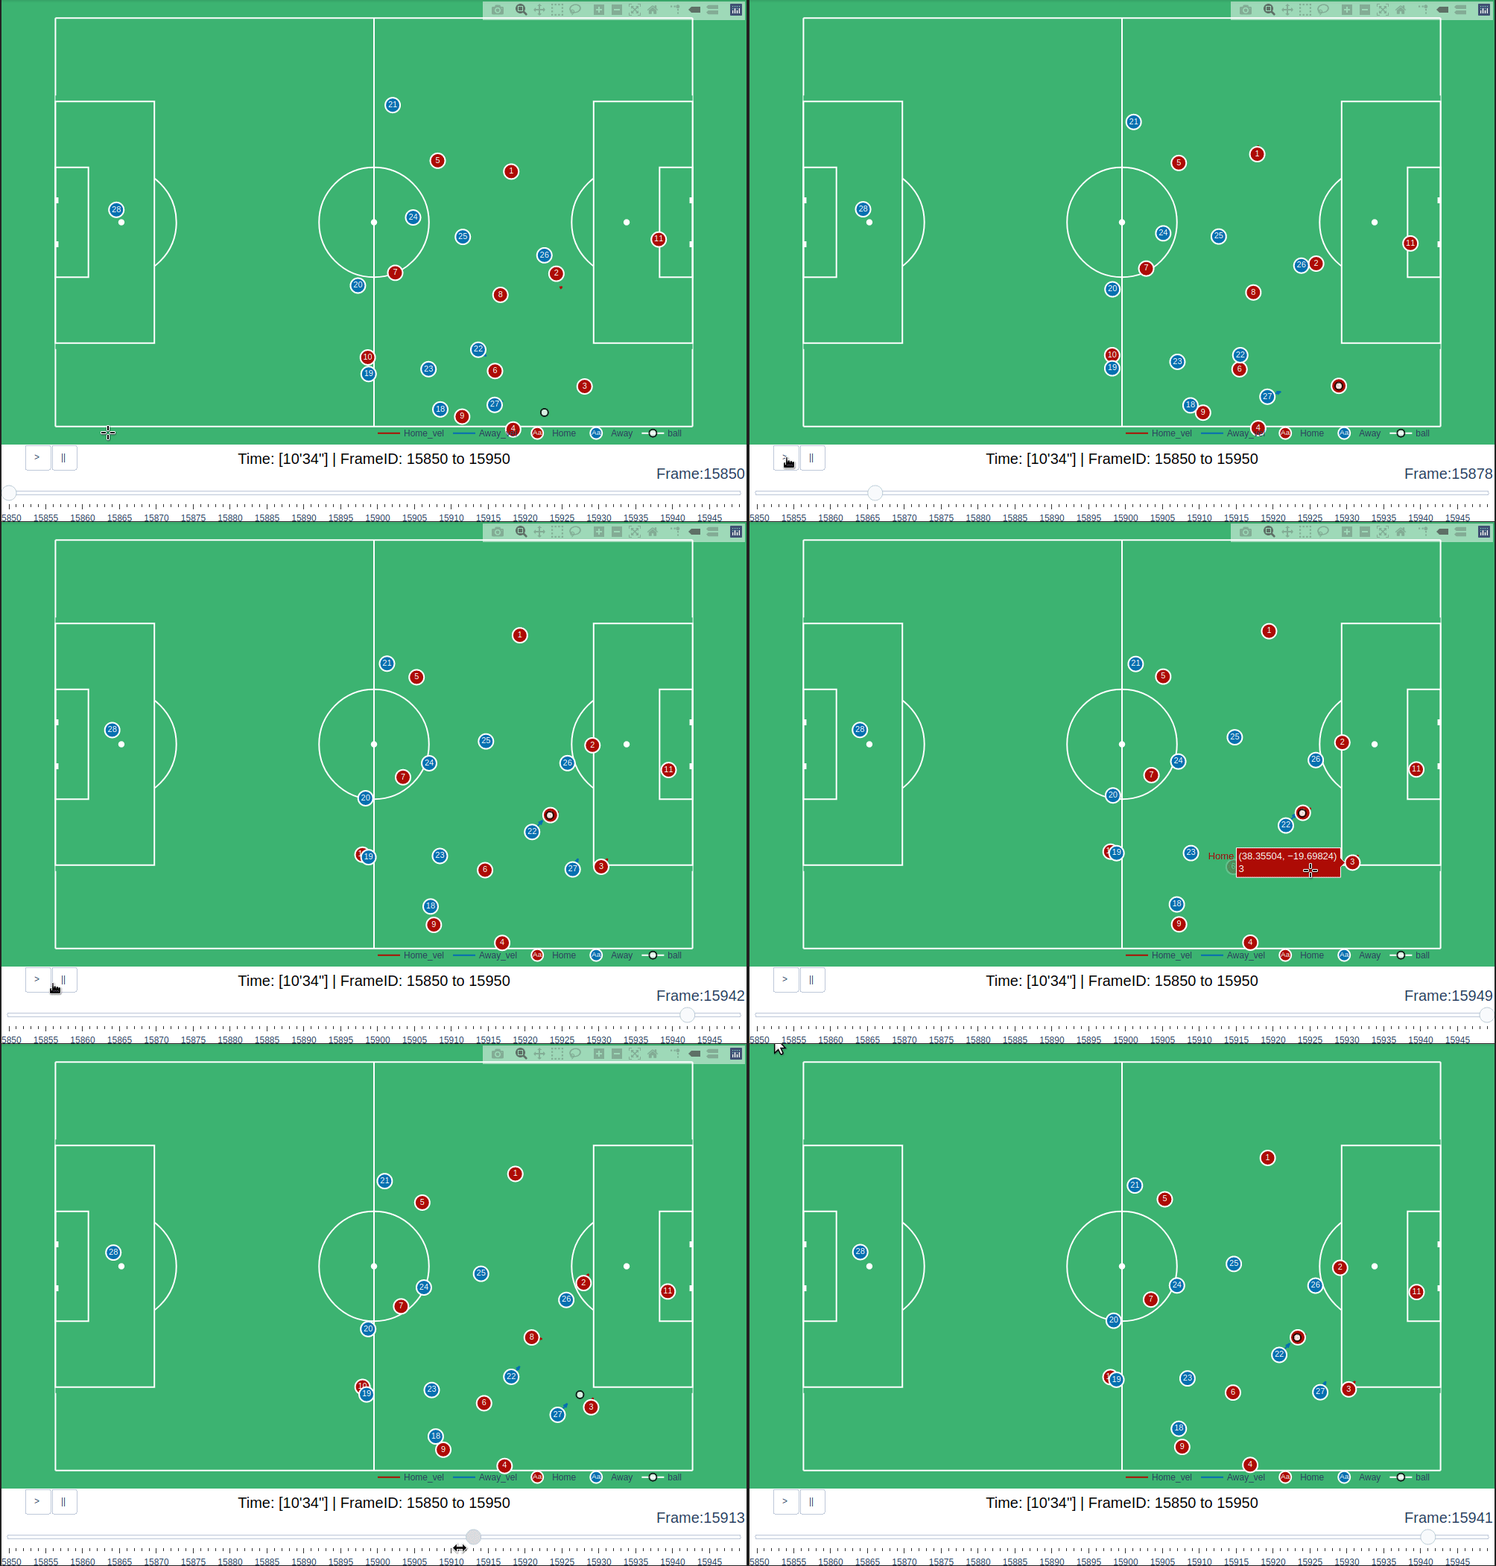
You can plot a sequence of frames with a slider to animate/track an event.
data.plot_sequence(f0=15850,f1=15950)
Plot Sequence by Time
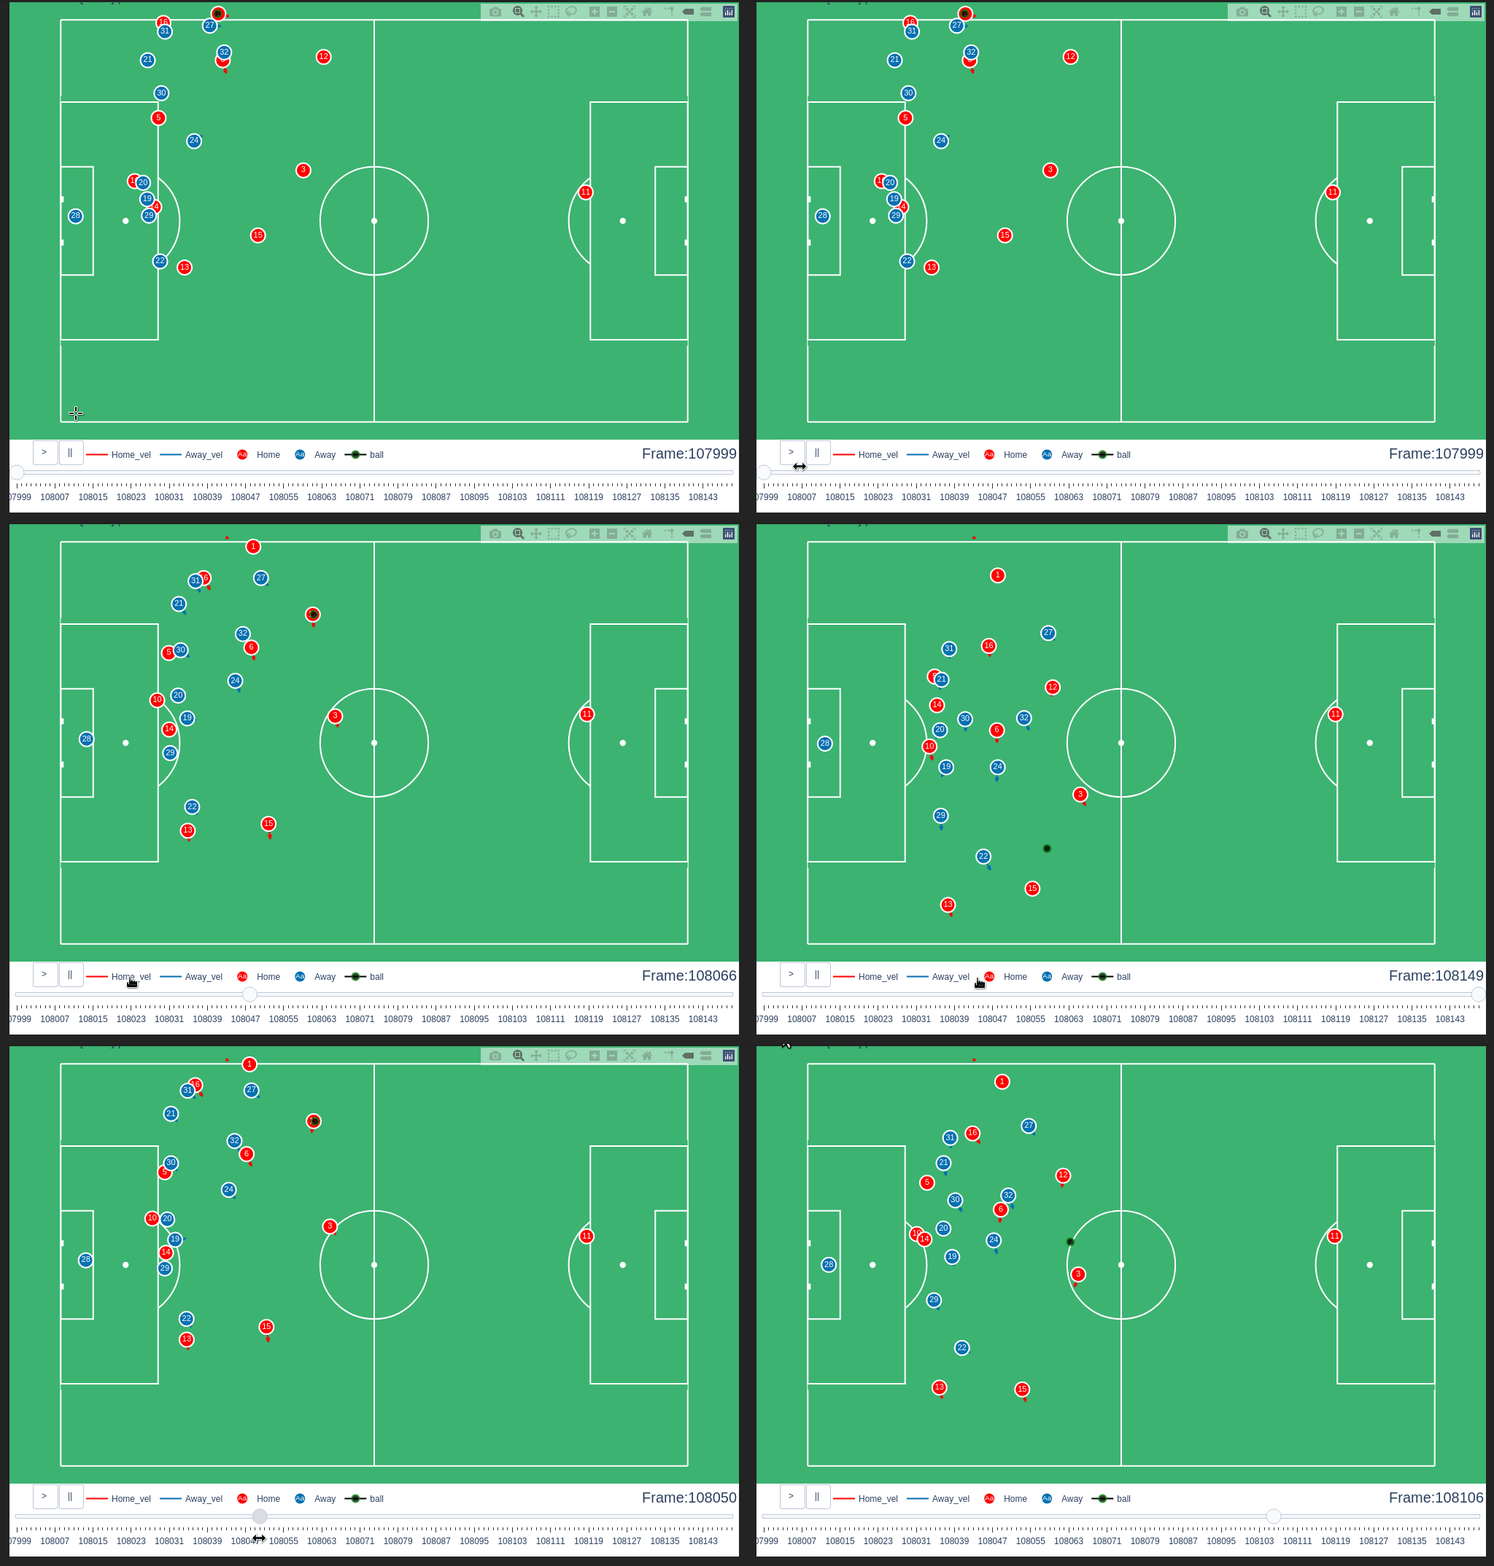
Or use the start time and end time for an interval sequence.
data.plot_sequence(t0='72',t1='72:06')
Pitch Control
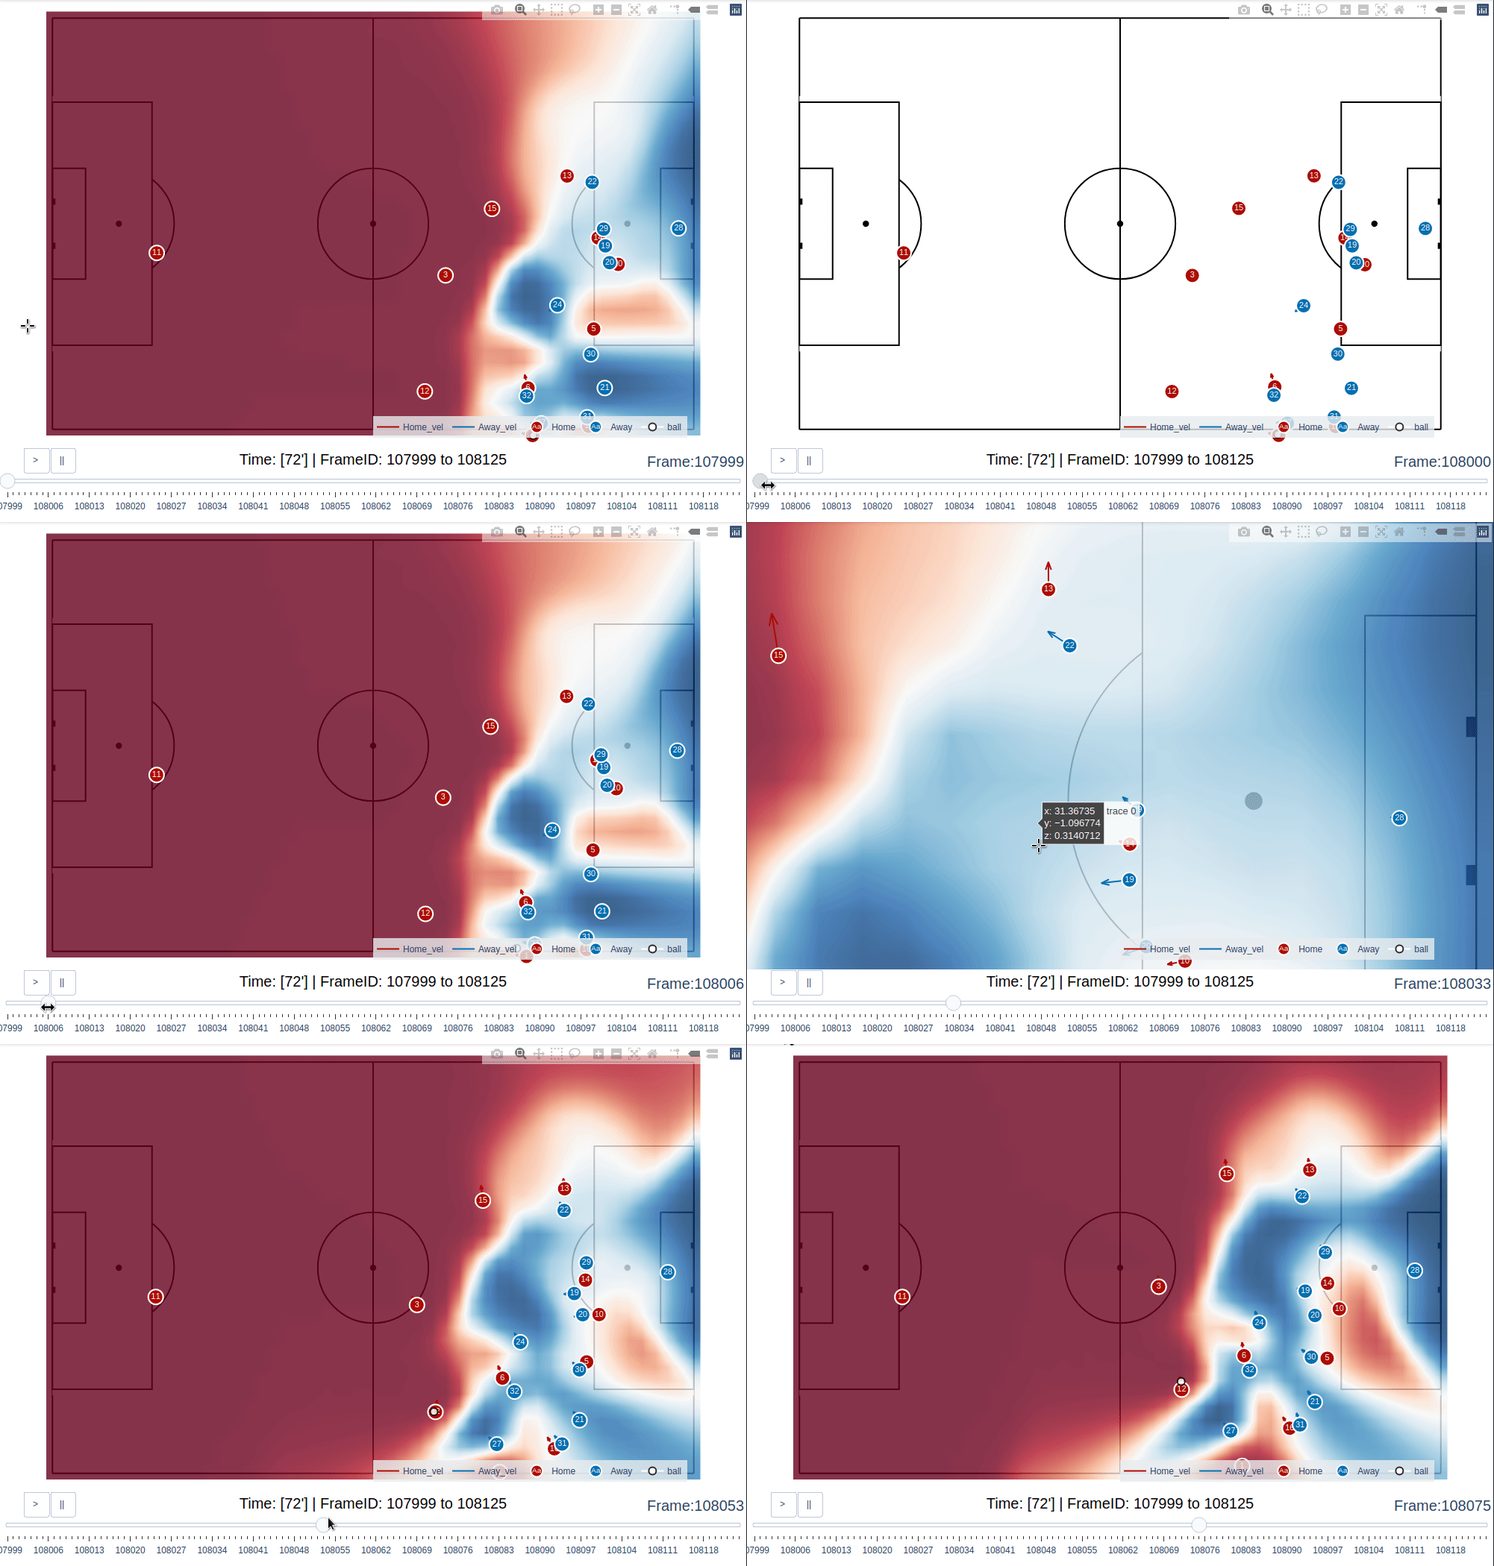
The pitch control is calculated by adapting Laurie Shaw’s work on William Spearman’s model. Since generating pitch control visualization on the fly gets sluggish, it is recommended to proceed with slight patience using the sliders (the pitch control overlay reloads with a tiny delay for every frame). The example shown here is for a very small time range (5 seconds / 125 frames) and generating the viz takes 7 minutes.
data.plot_sequence(t0='72',t1='72:05', pitch_control = True)
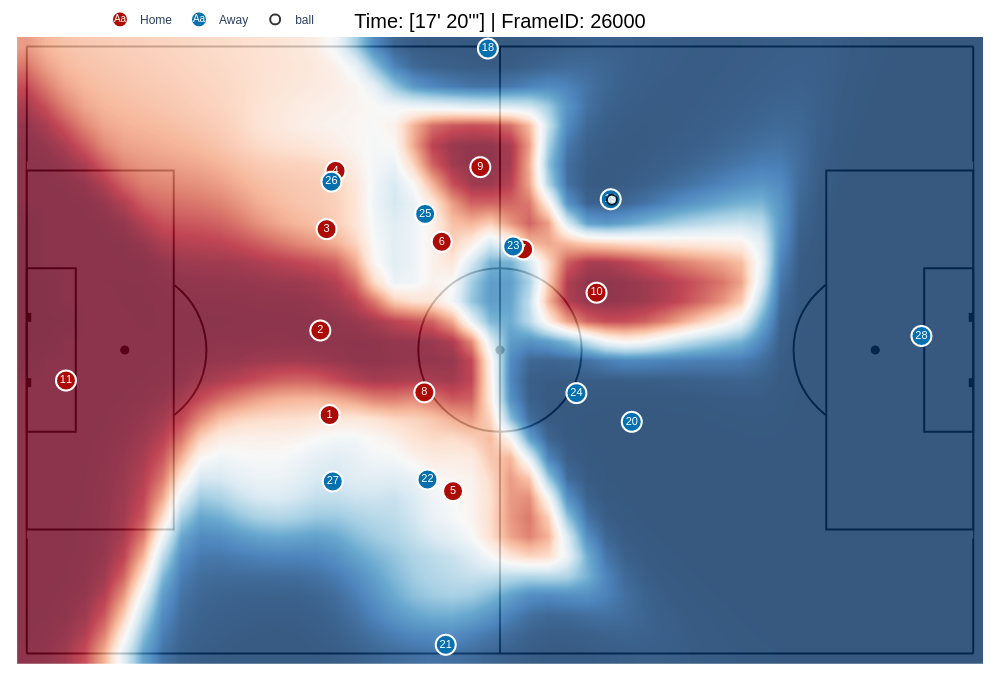
Generating pitch control overlay for individual frame/time inputs is fairly faster.
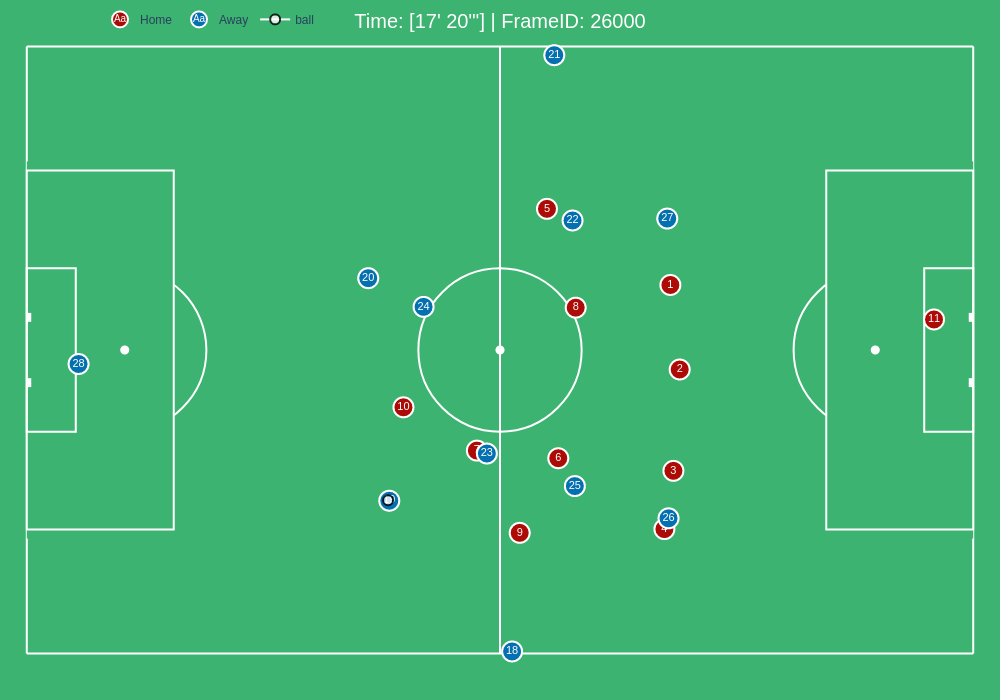
data.plot_frame(time='17:20', pitch_control = True)
Event Data
1# import the pitchly wrapper for metrica event data
2from pitchly.metrica import EventData
3
4# feed the loaded data
5data = EventData(event_dataset.events)
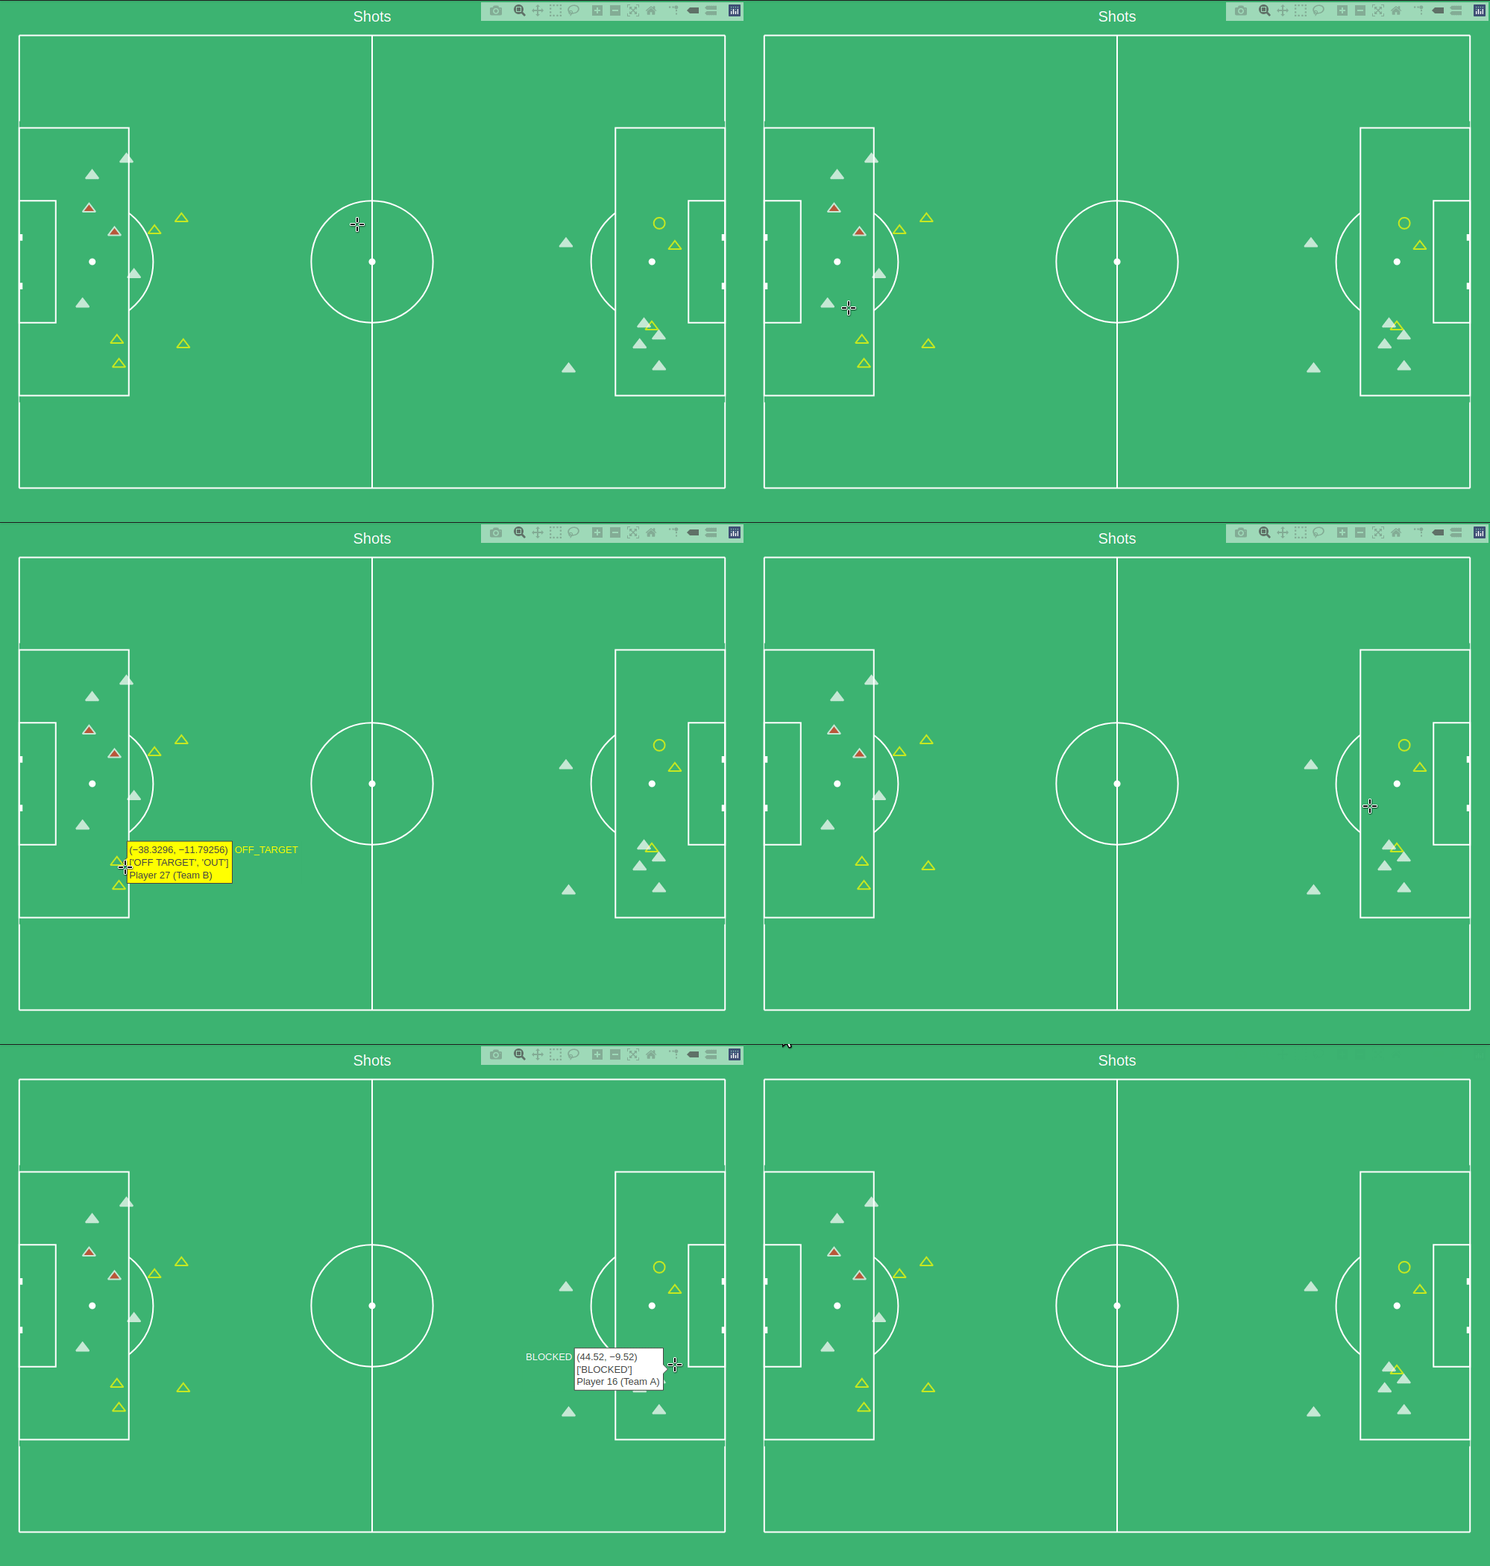
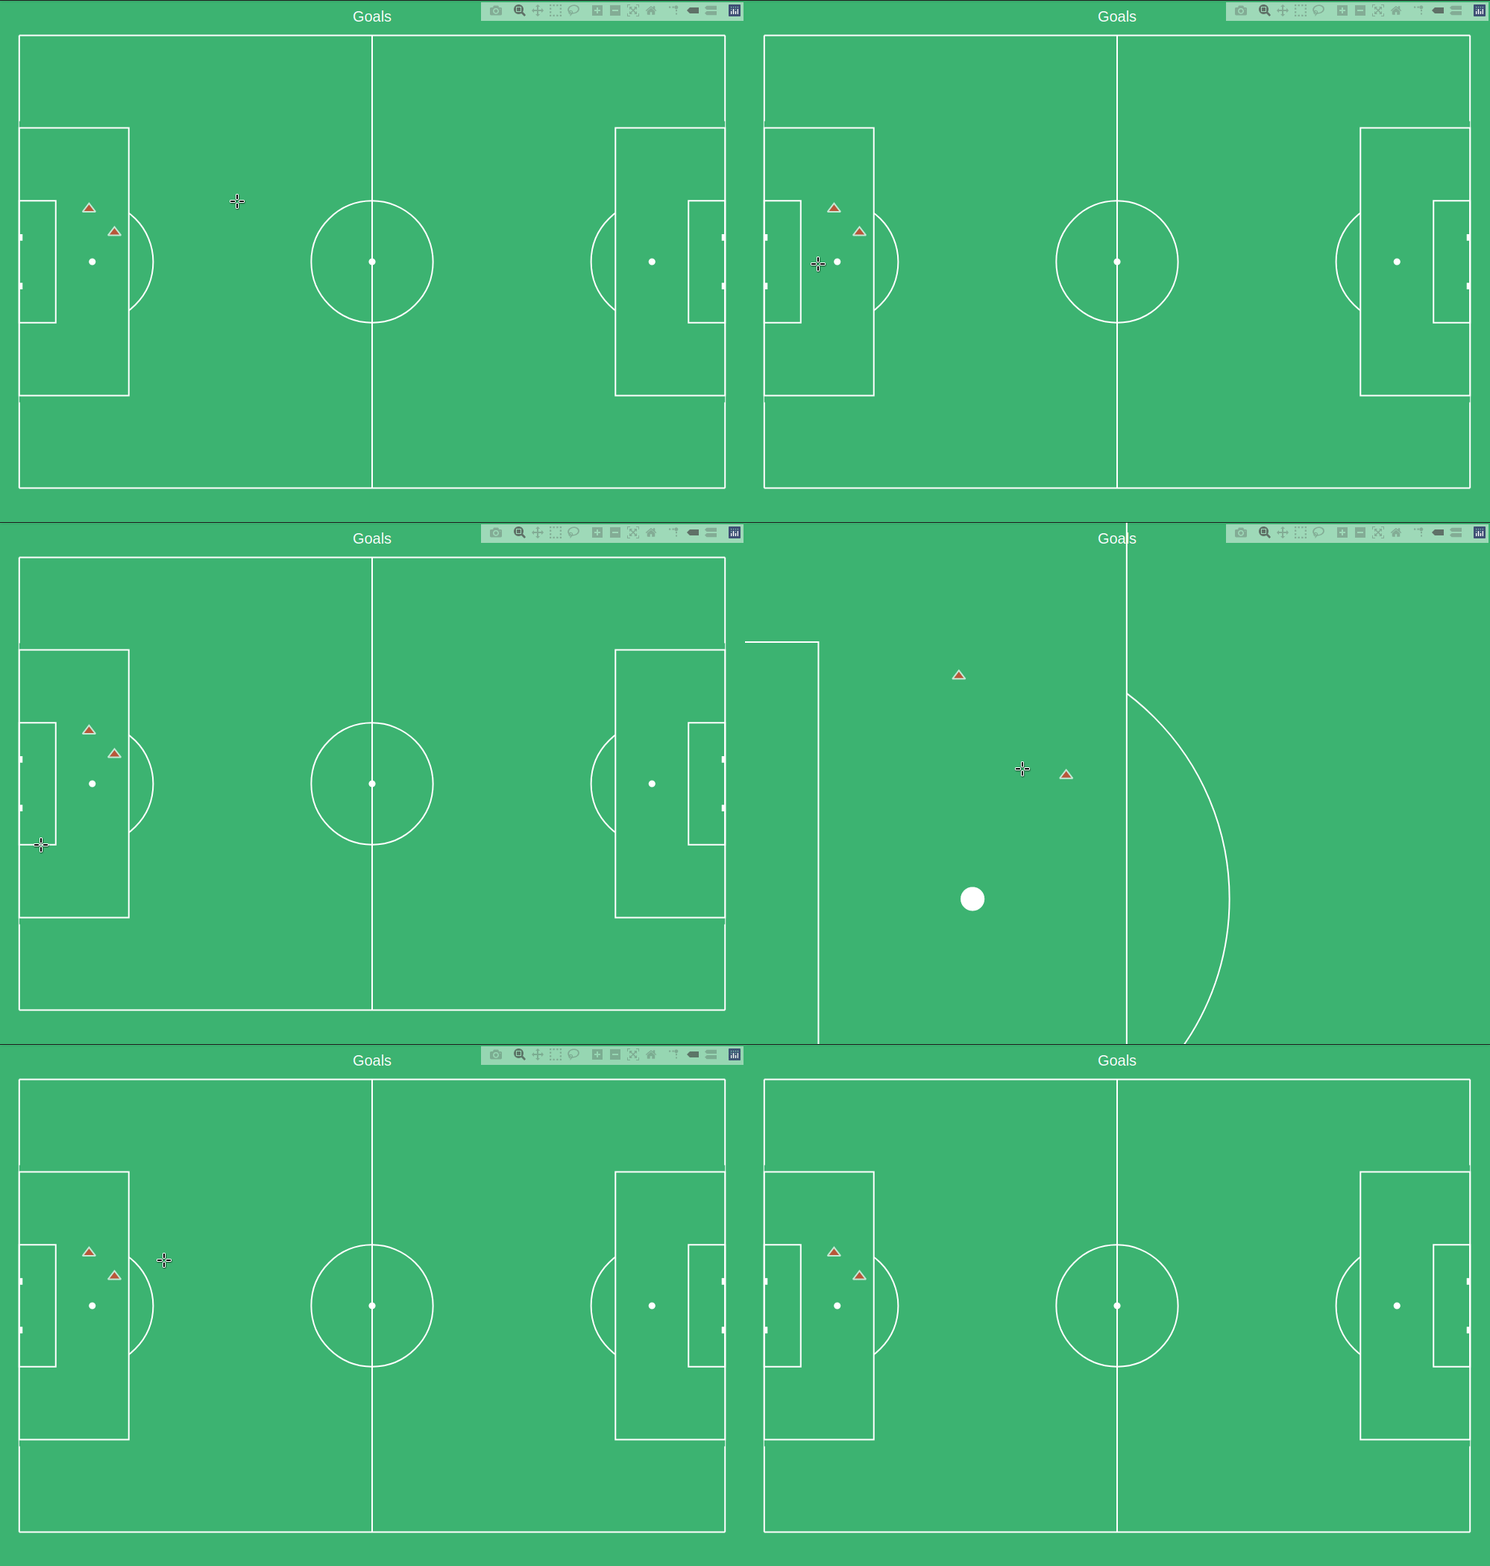
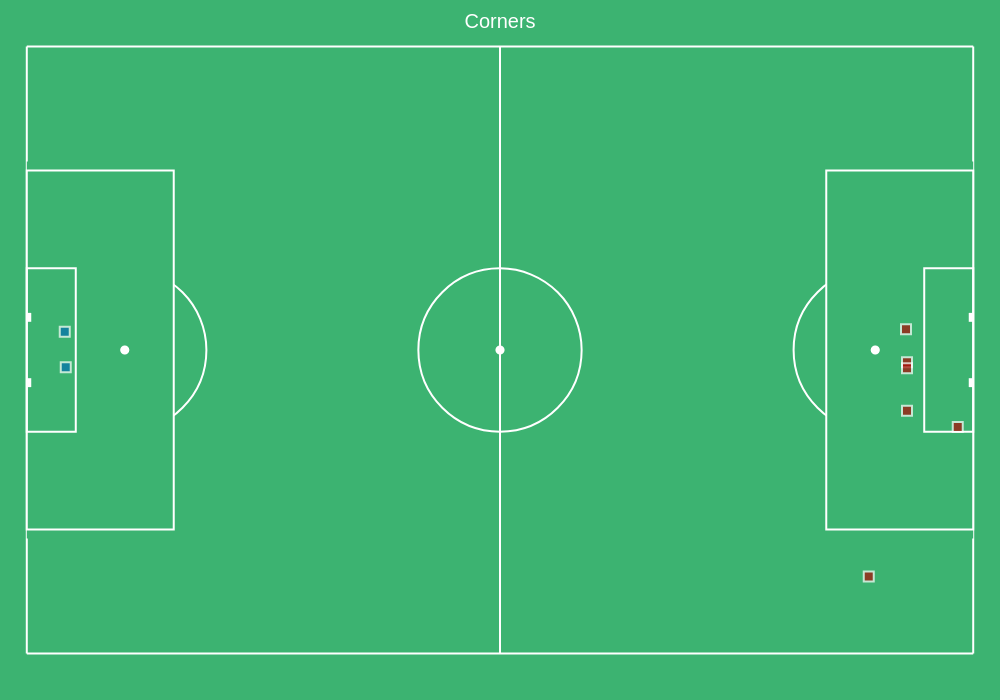
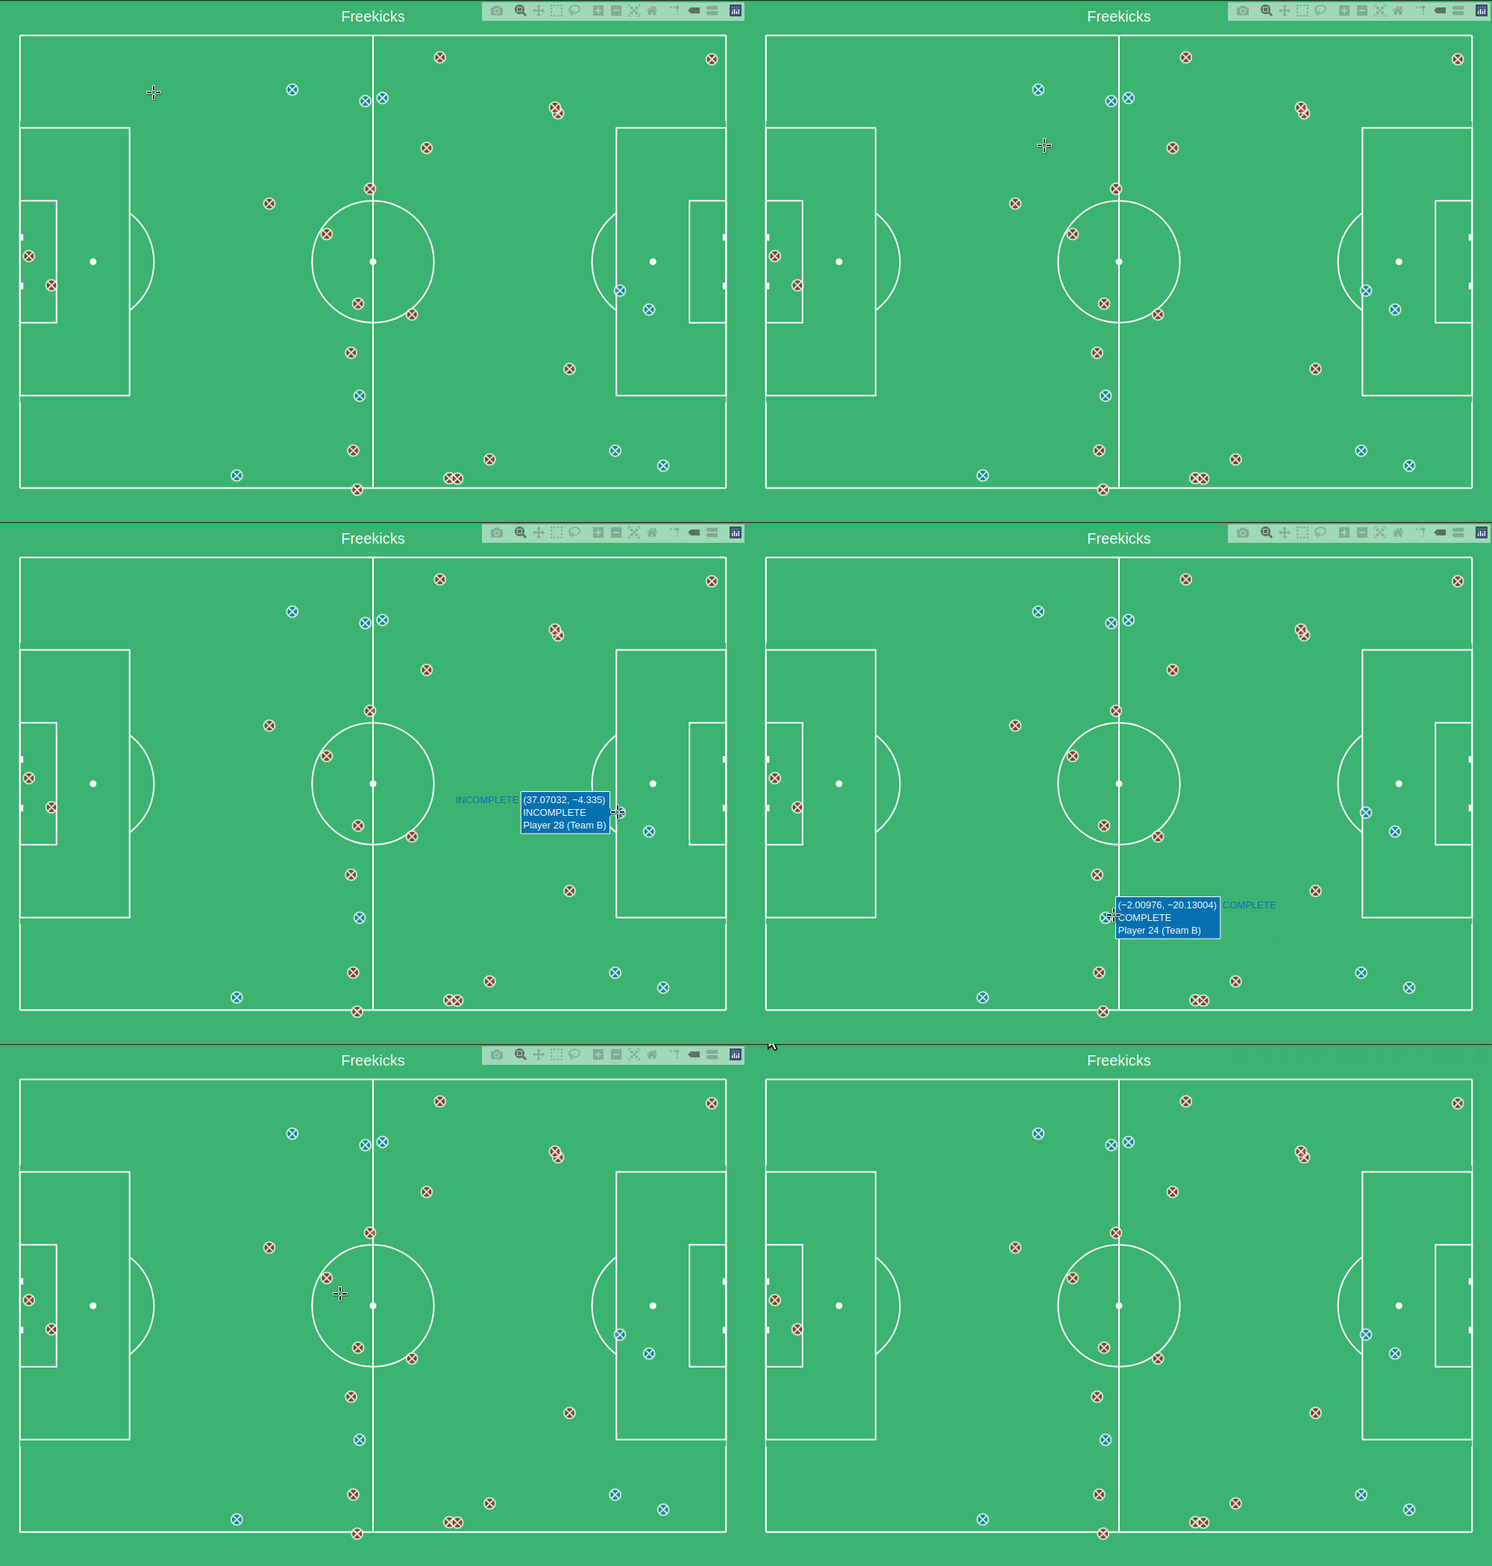
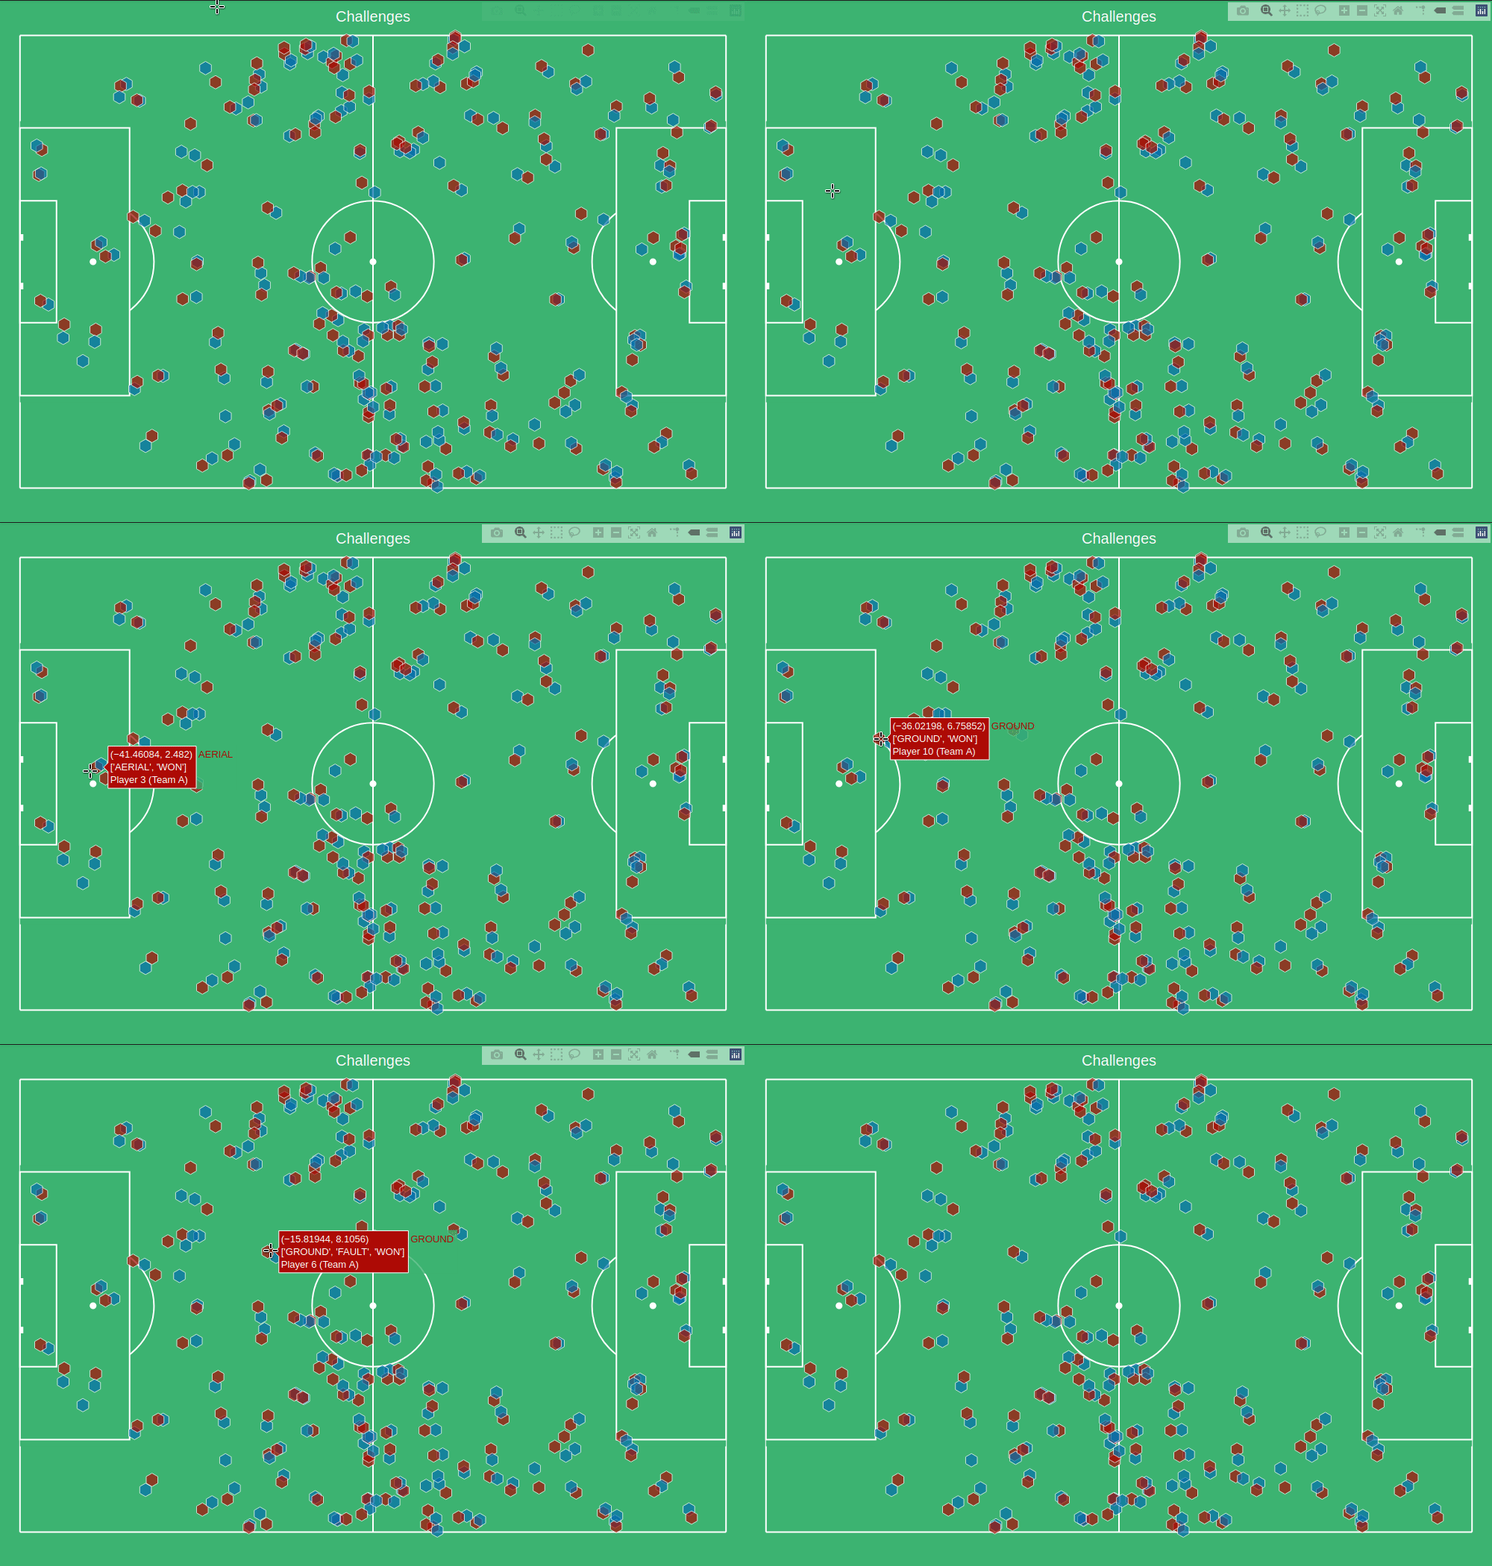
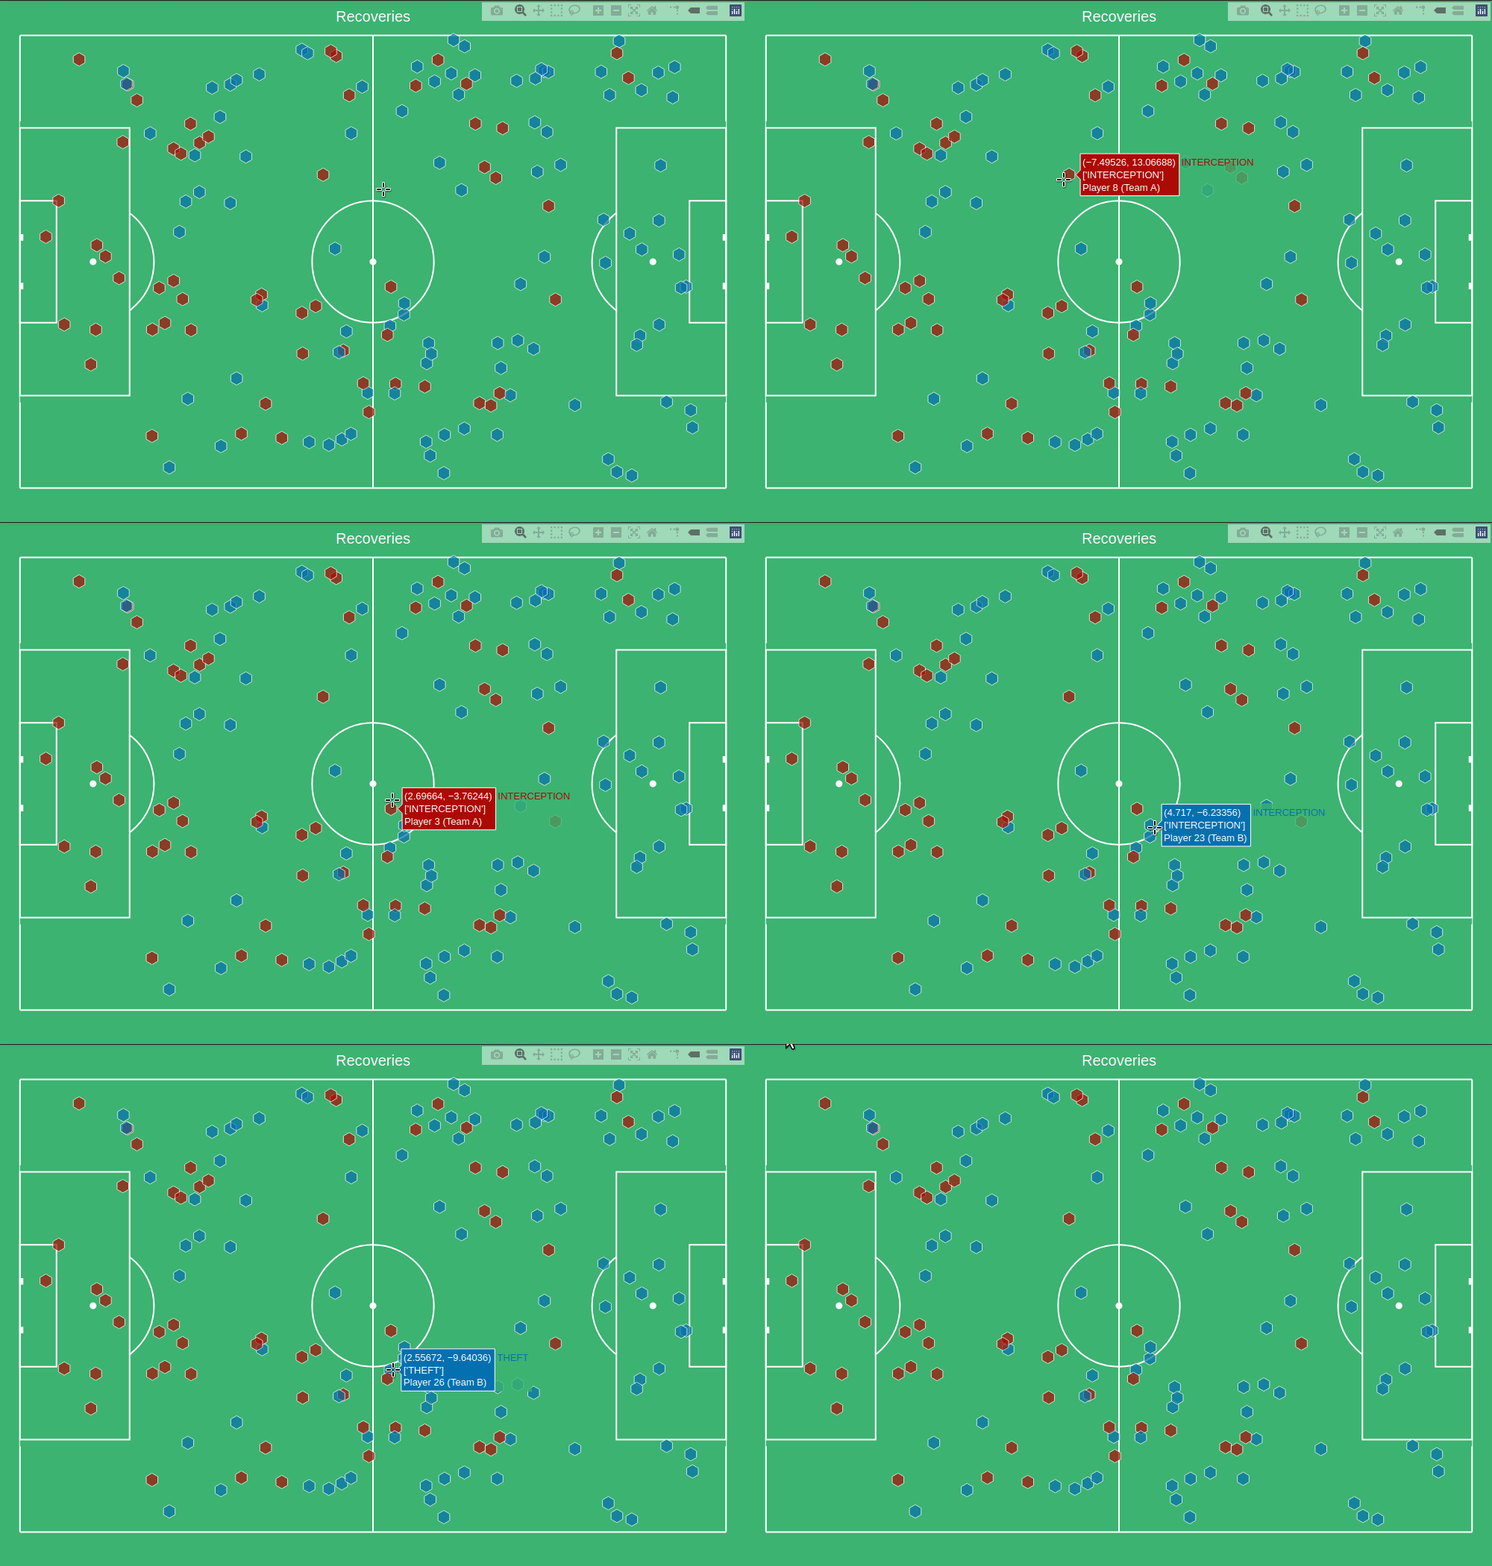
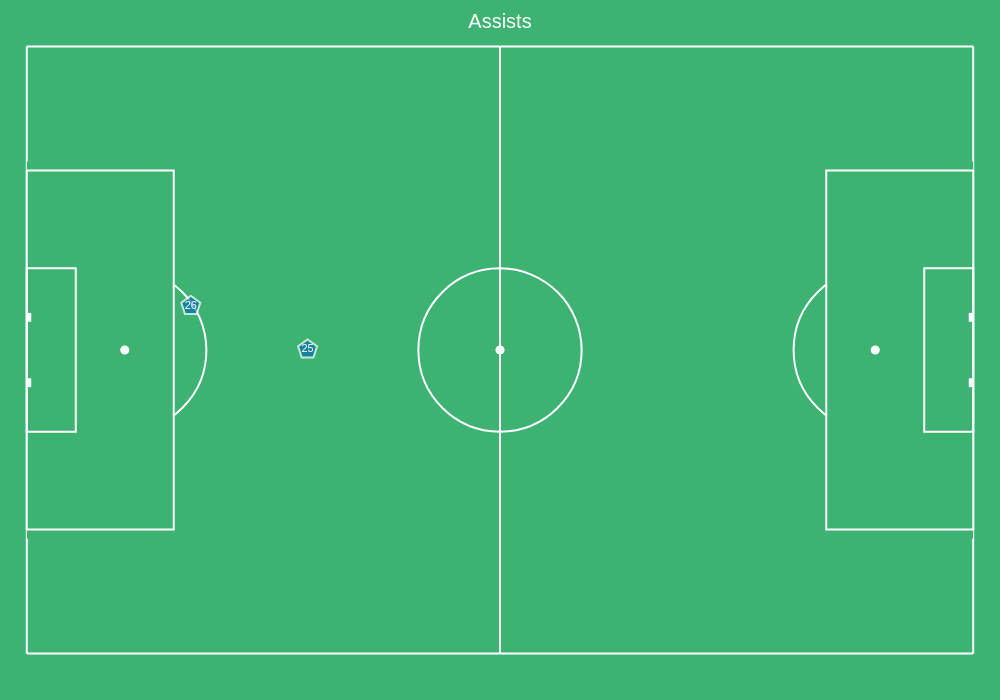
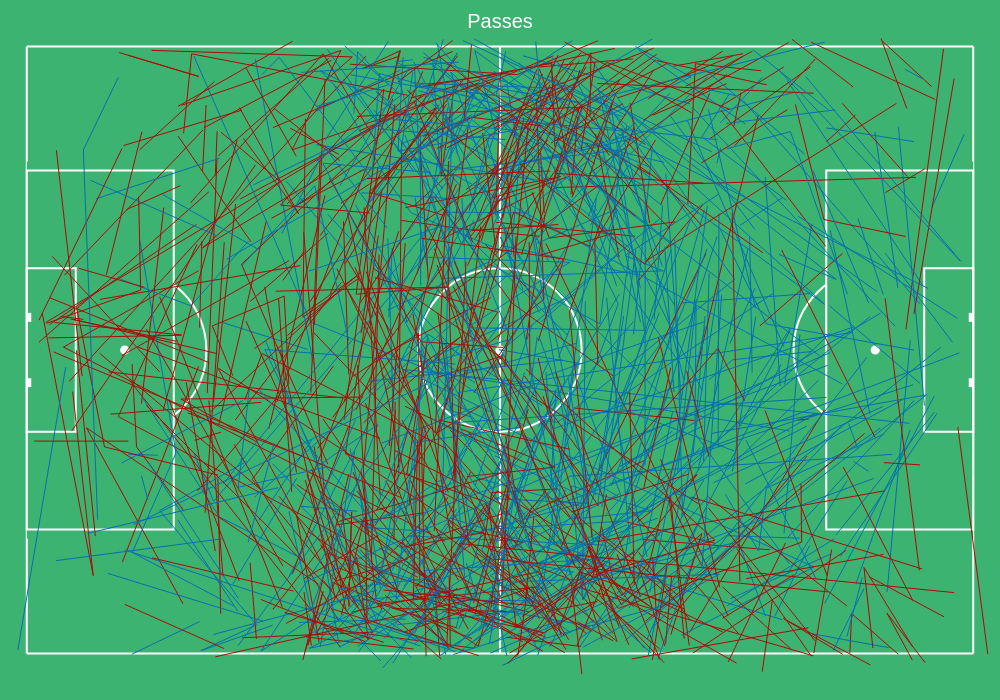
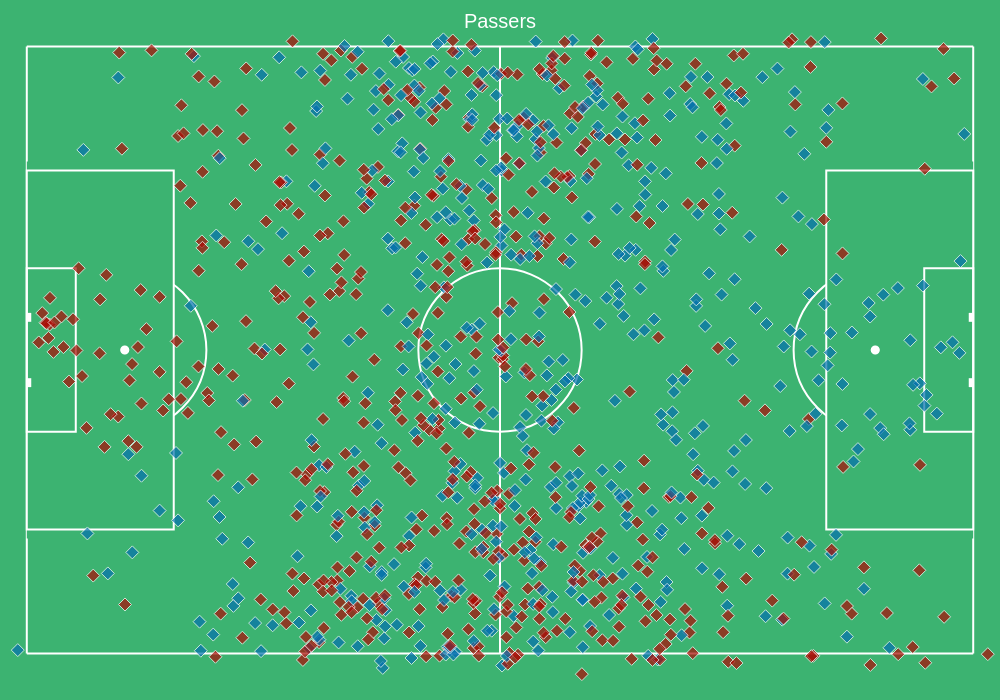
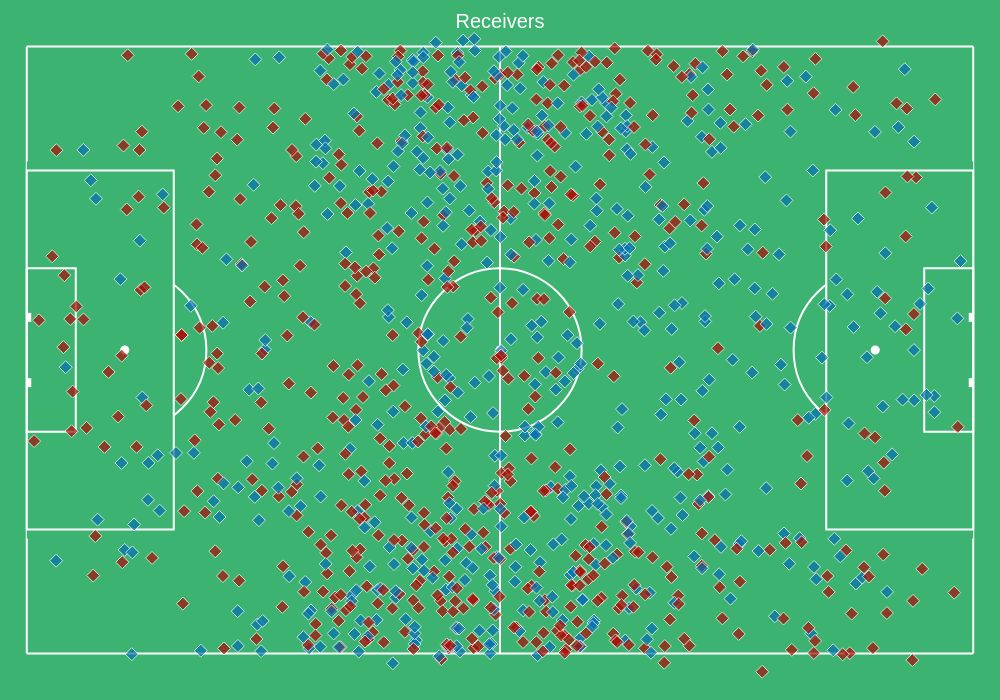
You can now plot various events cumulatively from the match by calling for type
Shot Assists
data.plot(type="shot_assists")
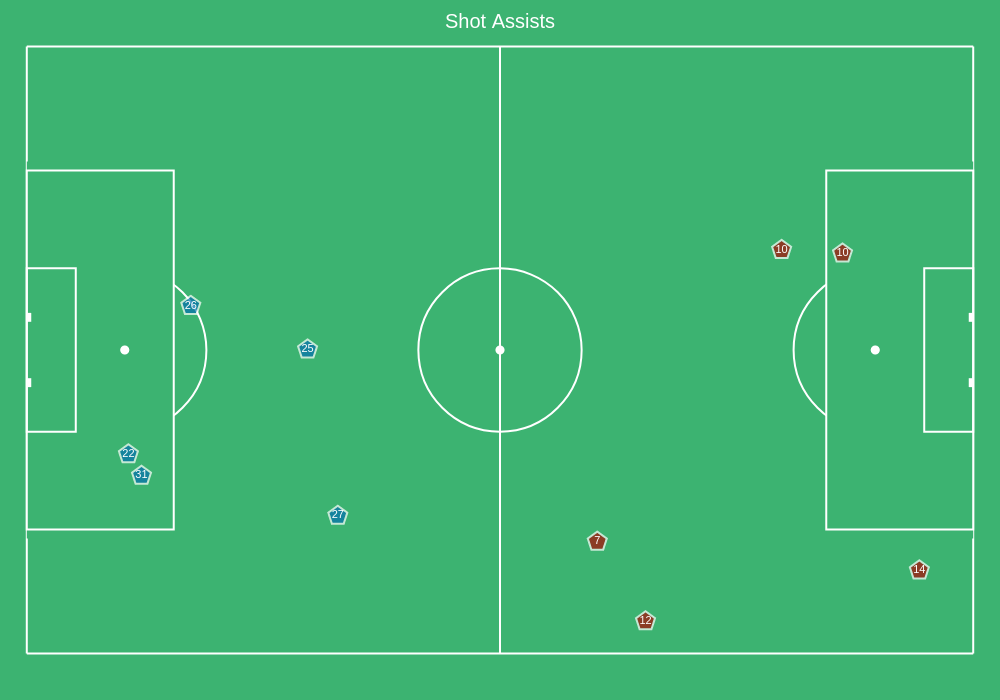
You can set trace=True to see the trace of the shot assists
Plot Event by Index
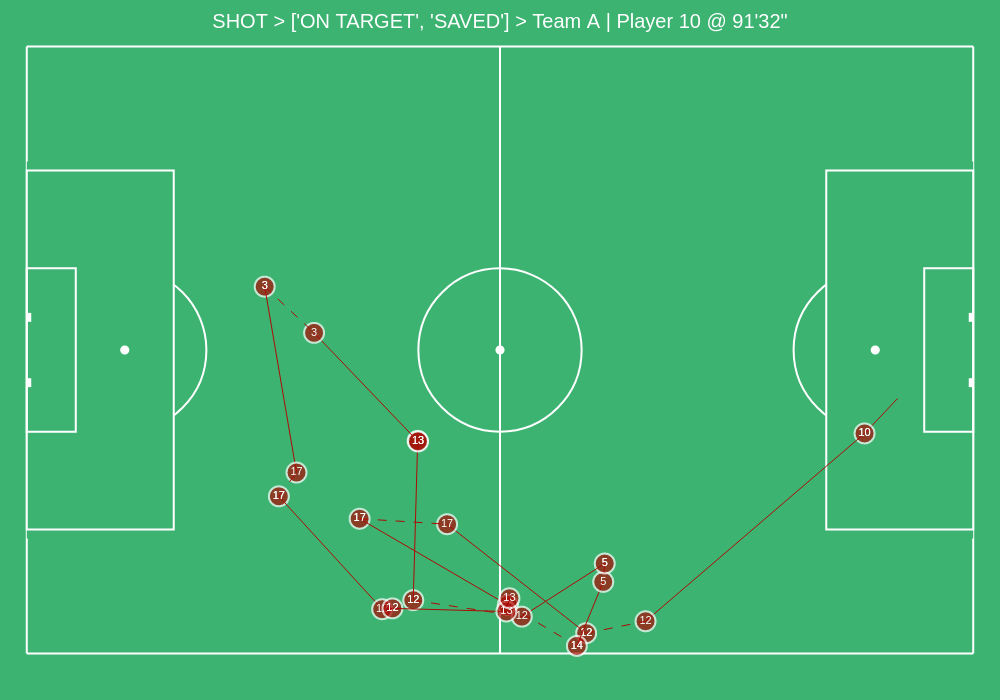
You can plot a specific event with its chain as follows:
data.plot(index=3478)
In order to know the index, you can browse the subset of choice using a kloppy helper:
kloppy.to_pandas(data.get_shots(),
                 additional_columns={'index_to_plot': lambda row: row.raw_event['index']}).set_index('index_to_plot')
Old Metrica Format (csv)
The older samples of Metrica data follow the .csv format and they can be loaded and used with pitchly in the following way:
 1import glob
 2from pitchly.utils import load_data
 3from pitchly.metrica_old import TrackingData,EventData
 4
 5# match directory
 6match_dir = "/match/folder/with/metrica/data/"
 7
 8# load the data
 9tracking_home, tracking_away, events = load_data(match_dir)
10
11# tracking
12data = TrackingData(tracking_home, tracking_away)
13data.plot_sequence(...)
14
15# events
16data = data = EventData(events)
17data.plot(type="shots", trace=True)